
Eclipse/Websphere |  |
- Installing plugin with Eclipse's update manager
- Installing plugin for Eclipse/Websphere(download)
- Launching QJ-Pro from Eclipse
- The Results Panes of QJ-Pro.
- The Observation Pane
- The Inspection Log Pane
- The Status bar
Installing plugin with Eclipse's update manager
If you are using Eclipse 3.0 or higher you can use the update manager to automatically download and install the QJ-Pro plugin.
- Start Eclipse, go to the Help menu->Software Updates->Find and install. Then add a new remote update site and use http://qjpro.sourceforge.net/update_site as url location.
- Obey the dialog prompts, and restart Eclipse. That's all there is to it!
Installing plugin for Eclipse/Websphere(download)
If you are an Eclipse version < 3.0 or you want to manually download the plugin you need to unzip the zip file called qjpro_Vx.x_eclipse.zip in the plugins directory of your Eclipse directory. After you restart Eclipse you are ready to use QJ-Pro in the Java perspective.
Launching QJ-Pro from Eclipse
Through the Integration package, QJ-Pro becomes an integral part of the Eclipse IDE. To see the QJ-Pro Obervations you need to activate the QJ-Pro View:
Window => Show View => Other ... => QJ-Pro=>QJ-Pro. The functionality will be automatically available within the IDE at installation of the Eclipse Integration for QJ-Pro.
The QJ-Pro functionality can be accessed through the QJ-Pro-buttons or using the mouse.
QJ-Pro-buttons
The QJ-Pro-buttons are only active when the editor shows a java source file and the editor has the focus.
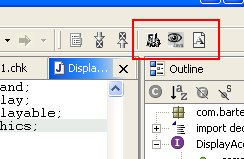
The first button is used to inspect the selected Java source file. The second button is used to inspect the complete Java project.The third button is used to show the annotated source file of the selected Java source file.
Mouse usage
If you press the right mouse button on a Java source file, Java package or Java project, a pop-up menu will appear with the standard Eclipse options extended with a QStudio menu. This QStudio menu includes the following menu options depending on the context: Inspect An analysis run is started for the selected file or node in the browser i.e. project, package or Java file. Annotated View A browser is launched showing the selected Java source file annotated with the observations, resulting from the last analysis run.
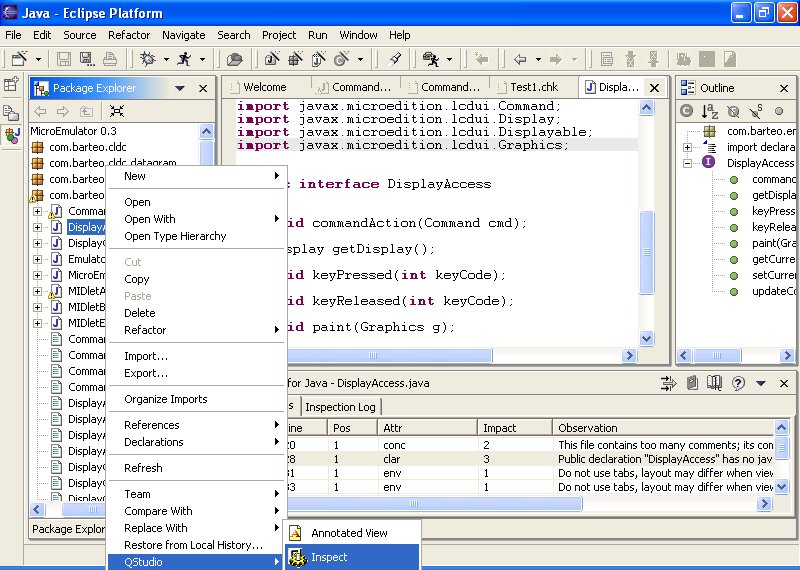
On the project node you can set the project properties and you can save the project. This menu options allows you to create a QJ-Pro project file which can be used for the Standalone version of QJ-Pro

The Results Panes of QJ-Pro.
Eclipse's main window consists of 4 panes. At the bottom we find the QJ-Pro pane besides the Tasks, Log Console and Console pane. The QJ-Pro Integration uses the QJ-Pro pane to show the processing results. In QJ-Pro pane 2 tabs are used the "Observations"- and "Inspection Log" tabs. The Observation tab shows a table of observation messages and related information. The Inspection Log tab shows the warnings/errors which occur during an analysis.
At the top on the rightside of the QJ-Pro pane you will find 4 icons.
The first icon is a shortcut to the setting of "Selection View". By default, the Observation Pane shows all observations of an analysis run. For convenience a view can be selected to limit the number of observations shown. See the tutorial on the Native client for a more detailed description of this pane. The second icon is a shortcut to the Rules Guide. The third icon is a shortcut to the Pattern Guide. The fourth icon is a shortcut to the User Manual.
The Observation Pane
The results of an analysis run are presented in a table. Each row relates to an observation. The following information is provided:
- ID: The identification number of the rule. This is a unique number that identifies the rule, all rules are specified in the rules guide.
- Line: The line number within the Java source file where the observation originates.
- Pos: The character position within the Java source code line where the observation originates.
- Attr: The quality sub-attribute that is assigned to the rule. See the concepts part for more information on quality (sub)-attributes.
- Impact: The impact level that is assigned to the rule. See the concepts part for more information on impact levels.
The columns can be sorted by clicking on the label of the column and a double clicking reverses the ordering.
The Eclipse Source Editor is synchronized by selecting a row in the observation table. The Source Editor Pane will show the code lines where the observation refers to.
The Inspection Log Pane
This window will contain all the errors which occurred during an inspection run. Click the right mouse button in the dialog to clear the inspection log. See the tutorial on the Native client for a more detailed description of this pane.
The Status bar
At the very bottom of the screen there is a status bar that shows the state of the tool.
