JDeveloper |  |
- Installing plugin for Oracle JDeveloper
- Launching QJ-Pro from JDeveloper
- The Results Panes of QJ-Pro
- The Observation Pane
- The Inspection Log Pane
- The Status bar
Installing plugin for Oracle JDeveloper
In order to use the plugin you need to unzip the zip file called qjpro_Vx.x_jdeveloper.zip in the jdev/lib/ext directory. After you restart JDeveloper you are ready to use QJ-Pro.
Launching QJ-Pro from JDeveloper
Through the Integration package, QJ-Pro becomes an integral part of the JDeveloper IDE. The QJ-Pro functionality will be automatically available within the IDE at installation of the JDeveloper Integration for QJ-Pro.
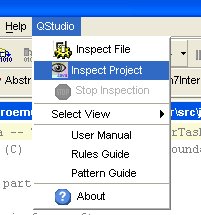
The QJ-Pro functionality can be accessed in 2 ways i.e. through the QJ-Pro-menu or through the QJ-Pro-buttons. Both options are fully integrated in the JDeveloper IDE.


The Results Panes of QJ-Pro
JDeveloper's main window consists of 4 panes. At the bottom we find the Message View. The QJ-Pro Integration uses this view to show the processing results in the tab QStudio. In this view 2 types of panes are used i.e. the Observation Pane(s) (default) and the Inspection Log Pane. The panes can be selected with the "<Project-name> Inspection"- and "Inspection Log" tabs. The Observation Pane shows a table of observation messages and related information. The JDeveloper Source Editor is synchronized by selecting a row in the observation table. The Source Editor Pane will show the code lines where the observation refers to. The Inspection Log Pane shows the warnings/errors which occur during an analysis.
The Observation Pane
For each JDeveloper project an Observation Pane is created. The results of an inspection run are presented in a list. Each line relates to an observation. See the tutorial on the Native client for a more detailed description of this pane.
The Inspection Log Pane
This window will contain all the errors which occurred during an inspection run. Click the right mouse button in the dialog to clear the inspection log. See the tutorial on the Native client for a more detailed description of this pane.
The Status bar
At the very bottom of the screen there is a status bar that shows the state of the tool.

